- 您现在的位置:买卖IC网 > Sheet目录2003 > LTC1415CG#TRPBF (Linear Technology)IC A/D CONV 12BIT SAMPLNG 28SSOP
9
LTC1415
APPLICATIONS INFORMATION
WU
U
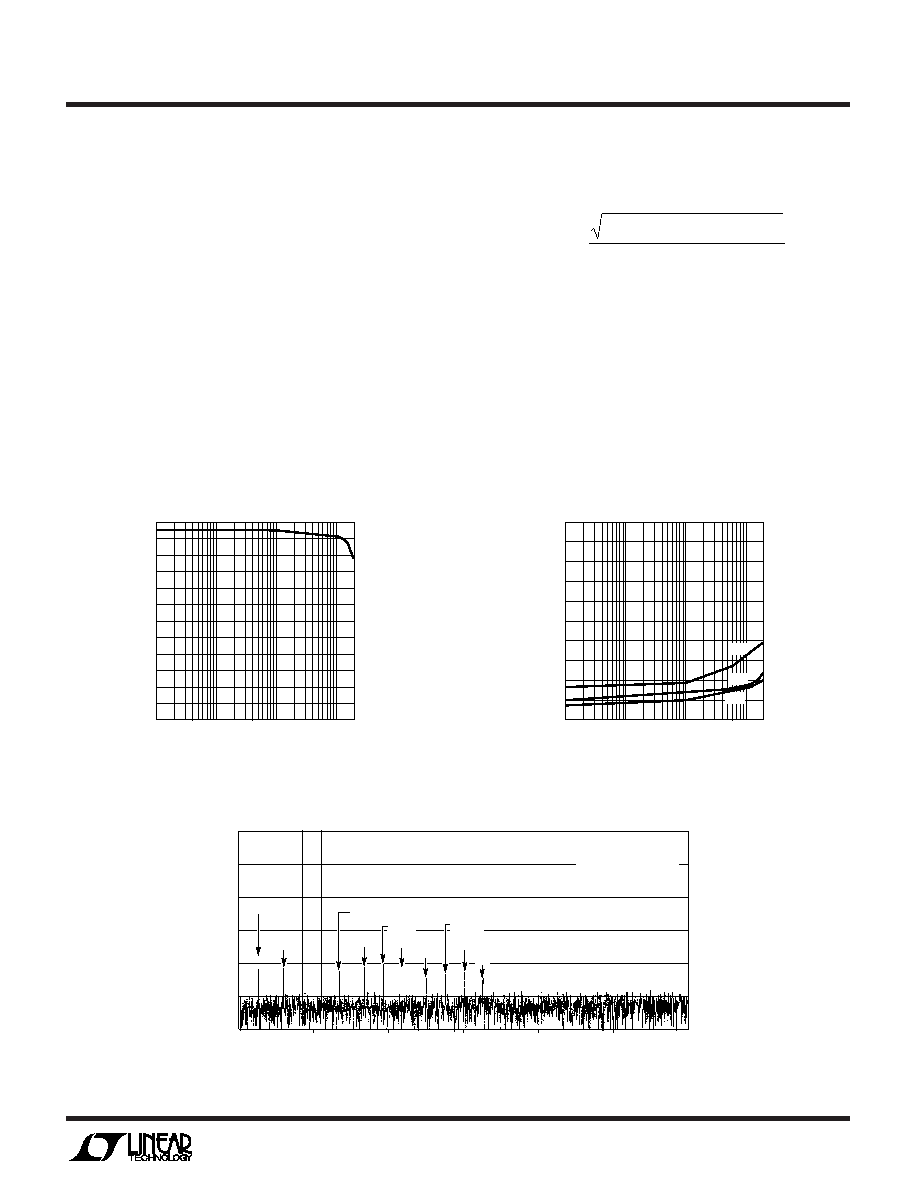
Effective Number of Bits
The effective number of bits (ENOBs) is a measurement of
the resolution of an ADC and is directly related to the
S/(N + D) by the equation:
N = [S/(N + D) – 1.76]/6.02
where N is the effective number of bits of resolution and
S/(N + D) is expressed in dB. At the maximum sampling
rate of 1.25MHz the LTC1415 maintains very good ENOBs
up to the Nyquist input frequency of 625kHz (refer to
Figure 3).
Total Harmonic Distortion
Total Harmonic Distortion (THD) is the ratio of the RMS
sum of all harmonics of the input signal to the fundamental
itself. The out-of-band harmonics alias into the frequency
band between DC and half the sampling frequency. THD is
expressed as:
THD
Log
VV
V
Vn
V
=
+++…
20
23
4
1
222
2
where V1 is the RMS amplitude of the fundamental fre-
quency and V2 through Vn are the amplitudes of the
second through nth harmonics. THD vs input frequency is
shown in Figure 4. The LTC1415 has good distortion
performance up to the Nyquist frequency and beyond.
Intermodulation Distortion
If the ADC input signal consists of more than one spectral
component, the ADC transfer function nonlinearity can
produce intermodulation distortion (IMD) in addition to
THD. IMD is the change in one sinusoidal input caused by
INPUT FREQUENCY (Hz)
EFFECTIVE
BITS
SIGNAL/(NOISE
+
DISTORTION)
(dB)
12
11
10
9
8
7
6
5
4
3
2
1
0
74
68
62
56
1k
100k
1M 2M
LT1415 F03
10k
Figure 3. Effective Bits and Signal/(Noise +
Distortion) vs Input Frequency
Figure 4. Distortion vs Input Frequency
FREQUENCY (Hz)
0
AMPLITUDE
(dB)
0
–20
–40
–60
–80
–100
–120
200k
300k
600k
LTC1415 F05
100k
400k
500k
fb – fa
2fb – fa
2fa – fb
2fa
2fb
3fb
fa + 2fb
3fa
2fa + fb
fa + fb
fSAMPLE = 1.25MHz
fIN1 = 86.97509766kHz
fIN2 = 113.2202148kHz
Figure 5. Intermodulation Distortion Plot
INPUT FREQUENCY (Hz)
AMPLITUDE
(dB
BELOW
THE
FUNDAMENTAL)
0
–10
–20
–30
–40
–50
–60
–70
–80
–90
–100
1k
100k
1M
2M
LTC1415 F04
10k
THD
2ND
3RD
发布紧急采购,3分钟左右您将得到回复。
相关PDF资料
LTC1416IG#TR
IC ADC 14BIT 400KSPS SMPL 28SSOP
LTC1417AIGN#TR
IC ADC 14BIT 400KSPS SMPL 16SSOP
LTC1418ACG#TRPBF
IC A/D CONV 14BIT SRL&PAR 28SSOP
LTC1419AISW#TRPBF
IC A/D CONV 14BIT SAMPLNG 28SOIC
LTC1420IGN#TRPBF
IC ADC 12BIT 10MSPS SAMPL 28SSOP
LTC1426IS8#TR
IC DAC PWM 6BIT DUAL MCPWR 8SOIC
LTC1427CS8-50#TRPBF
IC D/A CONV 10BIT W/SMBUS 8-SOIC
LTC1428CS8-50#TRPBF
IC D/A CONV 8BIT SINK OUT 8-SOIC
相关代理商/技术参数
LTC1415CSW
功能描述:IC A/D CONV 12BIT SAMPLNG 28SOIC RoHS:否 类别:集成电路 (IC) >> 数据采集 - 模数转换器 系列:- 标准包装:1,000 系列:- 位数:12 采样率(每秒):300k 数据接口:并联 转换器数目:1 功率耗散(最大):75mW 电压电源:单电源 工作温度:0°C ~ 70°C 安装类型:表面贴装 封装/外壳:24-SOIC(0.295",7.50mm 宽) 供应商设备封装:24-SOIC 包装:带卷 (TR) 输入数目和类型:1 个单端,单极;1 个单端,双极
LTC1415CSW#PBF
功能描述:IC A/D CONV 12BIT SAMPLNG 28SOIC RoHS:是 类别:集成电路 (IC) >> 数据采集 - 模数转换器 系列:- 标准包装:1 系列:microPOWER™ 位数:8 采样率(每秒):1M 数据接口:串行,SPI? 转换器数目:1 功率耗散(最大):- 电压电源:模拟和数字 工作温度:-40°C ~ 125°C 安装类型:表面贴装 封装/外壳:24-VFQFN 裸露焊盘 供应商设备封装:24-VQFN 裸露焊盘(4x4) 包装:Digi-Reel® 输入数目和类型:8 个单端,单极 产品目录页面:892 (CN2011-ZH PDF) 其它名称:296-25851-6
LTC1415CSW#TR
功能描述:IC ADC 12BIT 1.25MSPS SMP 28SOIC RoHS:否 类别:集成电路 (IC) >> 数据采集 - 模数转换器 系列:- 标准包装:1,000 系列:- 位数:12 采样率(每秒):300k 数据接口:并联 转换器数目:1 功率耗散(最大):75mW 电压电源:单电源 工作温度:0°C ~ 70°C 安装类型:表面贴装 封装/外壳:24-SOIC(0.295",7.50mm 宽) 供应商设备封装:24-SOIC 包装:带卷 (TR) 输入数目和类型:1 个单端,单极;1 个单端,双极
LTC1415CSW#TRPBF
功能描述:IC A/D CONV 12BIT SAMPLNG 28SOIC RoHS:是 类别:集成电路 (IC) >> 数据采集 - 模数转换器 系列:- 标准包装:1,000 系列:- 位数:12 采样率(每秒):300k 数据接口:并联 转换器数目:1 功率耗散(最大):75mW 电压电源:单电源 工作温度:0°C ~ 70°C 安装类型:表面贴装 封装/外壳:24-SOIC(0.295",7.50mm 宽) 供应商设备封装:24-SOIC 包装:带卷 (TR) 输入数目和类型:1 个单端,单极;1 个单端,双极
LTC1415CSWPBF
制造商:Linear Technology 功能描述:LTC1415CSWPBF
LTC1415IG
功能描述:IC A/D CONV 12BIT SAMPLNG 28SSOP RoHS:否 类别:集成电路 (IC) >> 数据采集 - 模数转换器 系列:- 标准包装:1,000 系列:- 位数:12 采样率(每秒):300k 数据接口:并联 转换器数目:1 功率耗散(最大):75mW 电压电源:单电源 工作温度:0°C ~ 70°C 安装类型:表面贴装 封装/外壳:24-SOIC(0.295",7.50mm 宽) 供应商设备封装:24-SOIC 包装:带卷 (TR) 输入数目和类型:1 个单端,单极;1 个单端,双极
LTC1415IG#PBF
功能描述:IC A/D CONV 12BIT SAMPLNG 28SSOP RoHS:是 类别:集成电路 (IC) >> 数据采集 - 模数转换器 系列:- 标准包装:1 系列:microPOWER™ 位数:8 采样率(每秒):1M 数据接口:串行,SPI? 转换器数目:1 功率耗散(最大):- 电压电源:模拟和数字 工作温度:-40°C ~ 125°C 安装类型:表面贴装 封装/外壳:24-VFQFN 裸露焊盘 供应商设备封装:24-VQFN 裸露焊盘(4x4) 包装:Digi-Reel® 输入数目和类型:8 个单端,单极 产品目录页面:892 (CN2011-ZH PDF) 其它名称:296-25851-6
LTC1415IG#TR
功能描述:IC ADC 12BIT 1.25MSPS SMP 28SSOP RoHS:否 类别:集成电路 (IC) >> 数据采集 - 模数转换器 系列:- 标准包装:1,000 系列:- 位数:12 采样率(每秒):300k 数据接口:并联 转换器数目:1 功率耗散(最大):75mW 电压电源:单电源 工作温度:0°C ~ 70°C 安装类型:表面贴装 封装/外壳:24-SOIC(0.295",7.50mm 宽) 供应商设备封装:24-SOIC 包装:带卷 (TR) 输入数目和类型:1 个单端,单极;1 个单端,双极